There are two interesting presentations from 2007 Wolfram Technology Conference.
Efficient Mathematica Programming: tips from MathGroup, very helpful.
A New Mathematica Programming Style: prefix and postfix-pure function is disscussed as an alternative to the traditional matchfix-dominated style
No advanced topic here, just some simple/silly/useless problems that slip into my mind during lunch break. Free use the contents in any way you like.
Feb 25, 2008
Google Static Maps API
Google finally release Google Static Maps API, which allows you to generate the maps using a regular URL (ala REST) along with parameters specifying location, size, etc and it returns a unique GIF image with that map.
However, there are several drawbacks, for example,
The following shows the API example:
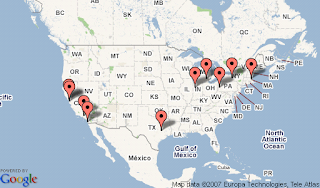
Top 10 "Mathematica" cites from Google Trends.
For fun, top 10 Mathematica cities vs top 10 Matlab cities
Red "M"--> Mathematica City, Blue "T" --> Matlab City, Green "B" --> City with both Mathematica and Matlab.
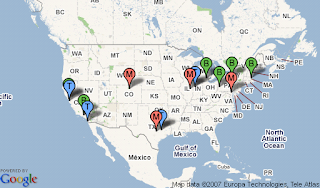
Update: static maps seems use the old data
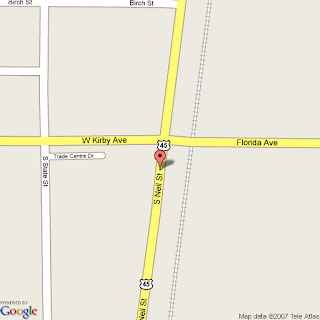
Noticed the problem with "Trade Center Dr",
Check this place on Google Map.
However, there are several drawbacks, for example,
512x512 is the largest image size allowed and geocoding is not integrated. Even though, it is better than nothing.The following shows the API example:
Top 10 "Mathematica" cites from Google Trends.

For fun, top 10 Mathematica cities vs top 10 Matlab cities
Red "M"--> Mathematica City, Blue "T" --> Matlab City, Green "B" --> City with both Mathematica and Matlab.

Update: static maps seems use the old data
Noticed the problem with "Trade Center Dr",
Check this place on Google Map.

Feb 17, 2008
Feb 8, 2008
Import High Resolution DEM (2)
We are talking about more general case here: DEM is processed in ArcGIS (e.g. Mosaic, Extract by Mask, etc.). And it is ready for computation in Mathematica. The DEM can be exported as Float32 format, imported with the procedure in the previous post.
In this post, the DEM is exported as ARCGrid ASCII format, the whole DEM is in one text file.
data = Import["DEM.txt", {"Lines", All}];
(* the first lines are metadata *)
meta = data[[1 ;; 6]]
{"ncols 1703", "nrows 1200", "xllcorner
-86.528233463385", "yllcorner 41.430023494444", "cellsize
0.00027777777779994", "NODATA_value -9999"}
(* drop the metadata *)
data = Drop[data, 6];
(* convert string to data *)
data = Map[ToExpression, StringSplit[#]] & /@ data;
The next step is that we will make the output of ReliefPlot match the other geographic data.
1. Deal with NOData: PlotRange->{zMin,zMax}
 2. Put the image into right geographic zone: DataRange-> {{Lon_Min, Lon_Max}, {Lat_Min, Lat_Max}}
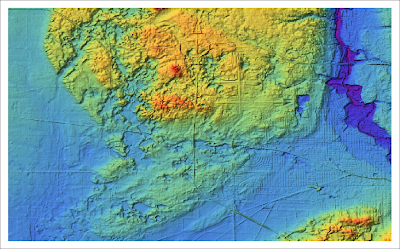
ReliefPlot[data, DataReversed->True, DataRange-> {{-86.5282, -86.0552}, {41.4300, 41.7634}}, PlotRange -> {199.0, 283.0}]
Then tested it with the map created in another post.
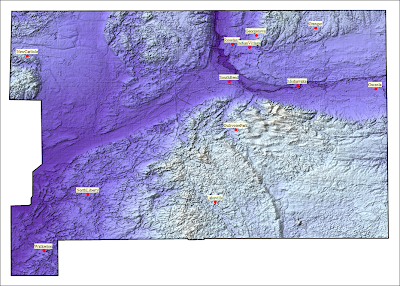
Note: ReliefPlot needs an option: NoData->{}
In this post, the DEM is exported as ARCGrid ASCII format, the whole DEM is in one text file.
data = Import["DEM.txt", {"Lines", All}];
(* the first lines are metadata *)
meta = data[[1 ;; 6]]
{"ncols 1703", "nrows 1200", "xllcorner
-86.528233463385", "yllcorner 41.430023494444", "cellsize
0.00027777777779994", "NODATA_value -9999"}
(* drop the metadata *)
data = Drop[data, 6];
(* convert string to data *)
data = Map[ToExpression, StringSplit[#]] & /@ data;
The next step is that we will make the output of ReliefPlot match the other geographic data.
1. Deal with NOData: PlotRange->{zMin,zMax}
 2. Put the image into right geographic zone: DataRange-> {{Lon_Min, Lon_Max}, {Lat_Min, Lat_Max}}
ReliefPlot[data, DataReversed->True, DataRange-> {{-86.5282, -86.0552}, {41.4300, 41.7634}}, PlotRange -> {199.0, 283.0}]
Then tested it with the map created in another post.

Note: ReliefPlot needs an option: NoData->{}
Import High Resolution DEM (1)
The best place to get high resolution DEM is from USGS National Map Seamless Server.
It publishes National Elevation Dataset (NED) in 1 arc second(~30m resolution), 1/3 arc second(~10m resolution) and 1/9 arc second(~3m resolution).
The default file format is ESRI ArcGRID. Several other non-proprietary formats are available. If you don't want to further process the DEM in ArcGIS, GridFloat format is the right choice. GridFloat is "a simple binary raster format (floating point data). There is an accompanying ASCII header file that provides file size information (number of rows and columns). The data are stored in row major order (all the data for row 1, followed by all the data for row 2, etc.)". See National Elevation Data (NED) FAQ.
Follow this tutorial for downloading procedure.
After downloading, unzip the file, .flt is the data for DEM, .hdr is the header ASCII file.
Open header file (.hdr)
ncols 650
nrows 395
xllcorner -86.428333330255
yllcorner 41.639166666159
cellsize 0.00027777777779995
NODATA_value -9999
byteorder LSBFIRST
We can see this DEM has 395 row and 650 col.
In Mathematica:
data30 = Import["ned30.flt", {"Binary", "Real32"}];
(* each row has 650 col. *)
data30 = Partition[data30, 650];
ReliefPlot[data30, DataReversed -> True, ColorFunction -> "Rainbow"]
The following examples show the same area in 1 arc second (30m) and 1/3 arc second (10m) DEMs.
30m

Feb 7, 2008
Select Point Data inside Geographical Boundary
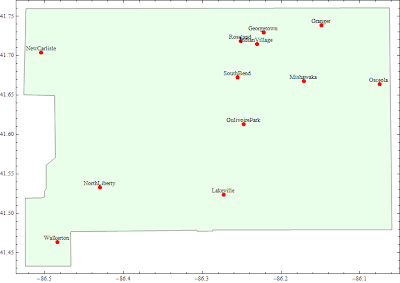
Here is an example on how to select point data inside the geographical boundary by using point inside polygon function.
(* all the cities {name, coordinates} in Indiana *)
allcities = {First[#], CityData[#, "Coordinates"]} & /@ CityData[{All, "Indiana", "UnitedStates"}];
We like to select the cities inside St. Joseph county.
Boundary of St. Joseph county is imported as Polygon. See details on importing GIS data.
In Mahtematica-users Wiki, there is an discussion on Point Inside Polygon. We choose the first solution, since it works on non-convex polygon.
(* select cities by Point inside Polygon function *)
Select[allcities, PLSPolygon[countyboundary, #[[2]]] &]

Feb 5, 2008
Fun with Financial Data: Currency Exchange Rates
Someone posted some interesting photos from his trip to Japan in this January. One is delicious sushi sold at the roadside in somewhere, Kyoto, Japan.

In the top row, the one marked for 900 Yen looks exactly like the ones sold here in greocery store. I am wondering the price in US dollars.
FinancialData[{"USD",#}] / FinancialData[{"JPY",#}] &/@ {"HKD","EUR","GBP","CAD"}
{106.842, 106.625, 106., 106.947}
Direct exchange rate is 106.825.
USD->GBP->JPY: lost near 1% USD->CAD->JPY: gain tiny 0.1%
Is there a simple way to find a currency exchange chain "USD->..->... ->JPY" to maximize the gain over "USD->JPY"?

In the top row, the one marked for 900 Yen looks exactly like the ones sold here in greocery store. I am wondering the price in US dollars.
900/FinancialData["USD/JPY"] gives $8.42, it is around 60% more expensive than the ones you can get here, however, it must taste much better.
One interesting thing is how much we can get if we convert 1 USD dollar to Japan Yen through the third currency.FinancialData[{"USD",#}] / FinancialData[{"JPY",#}] &/@ {"HKD","EUR","GBP","CAD"}
{106.842, 106.625, 106., 106.947}
Direct exchange rate is 106.825.
USD->GBP->JPY: lost near 1% USD->CAD->JPY: gain tiny 0.1%
Is there a simple way to find a currency exchange chain "USD->..->... ->JPY" to maximize the gain over "USD->JPY"?
Feb 4, 2008
Fun with MatrixPlot: Pixel Art
MatrixPlot is great for pixel art.
jp=MatrixPlot[pixelart, Frame->None, ColorRules->{0->White}, ColorFunction->#, ImageSize->90, Mesh->All, MeshStyle->LightGray] &/@ Append[ColorData["Gradients"], "Monochrome"]; GraphicsGrid[Partition[RandomSample[jp],8],Spacings->0]

ColorRules can be used for the better result, e.g. ColorRules -> {0 -> White, 1 -> Yellow, 2 -> Orange, 3 -> Pink, 4 -> Red}
jp=MatrixPlot[pixelart, Frame->None, ColorRules->{0->White}, ColorFunction->#, ImageSize->90, Mesh->All, MeshStyle->LightGray] &/@ Append[ColorData["Gradients"], "Monochrome"]; GraphicsGrid[Partition[RandomSample[jp],8],Spacings->0]
ColorRules can be used for the better result, e.g. ColorRules -> {0 -> White, 1 -> Yellow, 2 -> Orange, 3 -> Pink, 4 -> Red}
Subscribe to:
Comments (Atom)


