Showing posts with label Nonsense. Show all posts

May 11, 2011

Fun with Texture

Texture support is one major improvement in Mathematica 8.0. Sure, we can have some fun with it. Here is an example. We draw some polygons first.

animalcorssing2

Then some textures are applied, we get the following image. The main trick is to use alpha channel to get this cut-out texture mapping effect. The original tree image has the alpha channel already, we can use it directly, Texture[ImageData[tree]] will do the trick, if you use Texture[tree], somehow it will not pick up the alpha channel. For the character image, it doesn’t has the alpha channel, we can set a alpha channel by the following command:

SetAlphaChannel[im,
ChanVeseBinarize[ColorNegate@im] // FillingTransform ]

animalcorssing

By the way, the character is Tom Nook: "This isn't fat, I've just lined my insides with money."

Download the notebook.

Dec 21, 2010

Happy Holiday!

Happy Holiday!

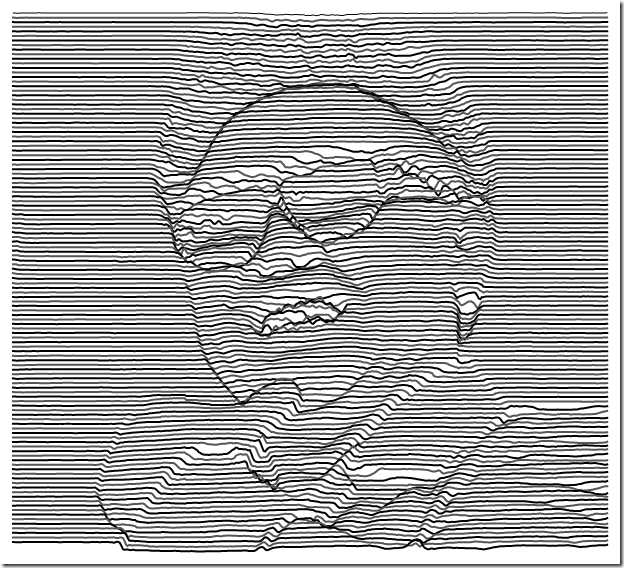
imagelineofart

Be a nice person in 2011, everyone will be happy.

How to generate this image?

First, find an image, then

img2 = ColorConvert[img, "HSB"];
img3 = ImageData[img2][[All, All, 3]];
ListPlot[Table[img3[[i]]*10 - i, {i, 1, ImageDimensions[img][[2]], 3}],
PlotRange -> All, Axes -> None, Joined -> True, PlotStyle -> {{Black}, {Thick, Lighter[Black]}}, AspectRatio -> ImageAspectRatio[img]]

Aug 25, 2009

Visualize irrational number as random walk

Irrational numbers have decimal expansions that neither terminate nor become periodic. So we can get unlimited “random walk” steps from an irrational numbers.

With the following code, the first 10000 digits of Sqrt[2] is presented as a random walk by converting it in base 4. 0, 1, 2 and 3 digit in base 4 represent 4 directions. Starting point is the green dot, the red one is the ending point.

x = N[Sqrt[2], 10000];
walk = First@ RealDigits[x, 4];
rn = FoldList[Plus, {0, 0}, {{0, 1}, {1, 0}, {0, -1}, {-1, 0}}[[# + 1]] & /@ walk];
Graphics[{Line[rn], PointSize[Large], Green, Point[First@rn], Red, Point[Last@rn]}]

randomwalk1

We can also display it with ArrayPlot by constructing a sparse array.

(* shift the moves to {1,1} *)

minx = Min[rn[[All, 1]]];
miny = Min[rn[[All, 2]]];
m = # + {-minx + 1, -miny + 1} & /@ rn;

(* sparse array *)

tt = Tally[m];
cd = SparseArray[tt[[All, 1]] -> tt[[All, 2]]];
cd = Transpose[cd];
ArrayPlot[cd, ColorFunction -> "Rainbow", DataReversed -> True, ColorRules -> {0 -> White}]

randomwalk2

Let’s visualize Sqrt[2], e, Pi in their first 50000 digits. It seems there are some similarities among these images.

Sqrt[2]

2

Pi

Pi

e

e

Update:

DrMajorBob said... in comments:

Here's a 3D version:

x = N[Sqrt[2], 10000];
walk = First@RealDigits[x, 6];
rn = FoldList[ Plus, {0, 0, 0}, {{0, 1, 0}, {1, 0, 0}, {0, -1, 0}, {-1, 0, 0}, {0, 0, 1}, {0, 0, -1}}[[# + 1]] & /@ walk ];
Graphics3D[{Line[rn], PointSize[Large], Green, Point[First@rn], Red, Point[Last@rn]}]


3d

You can also try non-irrational number, e.g. 121/5^10

Thanks.

Update 2:

Visualize genome sequence. I know nothing about it, it probably totally meaningless.

GenePlot[g_] := Module[{cs, rn}, walk = Characters[GenomeData [g, "FullSequence"]] /. {"A" -> 1,  "T" -> 2, "G" -> 3, "C" -> 4};
  rn = FoldList[Plus, {0, 0}, {{0, 1}, {1, 0}, {0, -1}, {-1, 0}}[[#]] & /@ walk];
  Graphics[{Line[rn], PointSize[Large], Green, Point[First@rn], Red, Point[Last@rn]}, Frame -> True, FrameTicks -> None] ]

GenePlot["DDK4"]

geneplot

GenePlot["DKK3"]

geneplot2

Feb 22, 2009

Counting coins with image processing

Today I read a paper about automatically counting trees from satellite image, that makes me remember the coin-counting example from image processing class which I took many years ago.

I put some coins on the back of the mouse pad, snap a photo with the web camera.

picanom-picture-01-2009-02-22

img2 = Binarize[img]

countcoin2

img3 = ArrayPlot[MorphologicalComponents[img2]]

countcoin3

Now let’s do the counting.

cd = Tally[Flatten[MorphologicalComponents[img2]]]

{{0, 162643}, {1, 7600}, {2, 7633}, {3, 7369}, {4, 4309}, {5,
  7679}, {6, 5868}, {7, 5883}, {8, 4082}}

(* pick the image region which is possible for the coins *)

cd2 = Select[cd[[All, 2]], # > 500 && # < 10000 &]

ListPlot[cd2, PlotStyle -> {PointSize[Large]}]

countcoin4

Clearly, there are three different groups of coins

Total[Map[Length, Sort[FindClusters[cd2]]] {5, 10, 25}]

130

Using $xxxx Mathematica to counting coins is kind of stupid itself, however, there are plenty of engineering applications actually do the very similar things in more complex situations. 

Apr 4, 2008

Nonsense

The early sign of scientist self-destruction nature.


mushroom is from http://www.wpclipart.com/plants/mushroom/mushroom.png