
Dec 31, 2007
Happy New Year 2008: in security image way
ArrayPlot[ReplacePart[Rasterize[Framed["HAPPY NEW YEAR 2008"], "RGBColor", ImageSize->300, Background->LightYellow], Table[RandomInteger[{1,350},2] -> Hue[RandomReal[1]], {30000}]], Frame->False]

Draw a simple 3D Globe
A sphere + Longitude lines + Latitude lines + Boundaries from CountryData = a simple 3D Globe


Dec 28, 2007
Leader of the world? again
Use the flags at the vertices of the graph.
VertexRenderingFunction -> (Inset[Show[CountryData[#2, "Flag"], ImageSize -> 30], #] &)
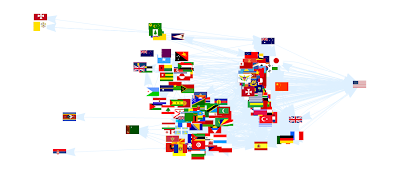
See the original.
VertexRenderingFunction -> (Inset[Show[CountryData[#2, "Flag"], ImageSize -> 30], #] &)

See the original.

Dec 27, 2007
Working with image: Mosaic images
Creating the image mosaic can be very easy in Mathematica.
First, what's inside the image?
Import["mnt.png", "Elements"]]
{"BitDepth", "ColorMap", "ColorSpace", "Data", "DataType", "Graphics", "GrayLevels", "ImageSize", "RawData", "RGBColorArray"}
We only need use the "Data": Import["mt.png","Data"]
Here we "steal" some images from Almighty Google as the example.
Import the following four images (a0,a1,a2,a3)
a0: http://mt0.google.com/mt?n=404&v=ap.66&x=0&y=0&zoom=16
a1: http://mt1.google.com/mt?n=404&v=ap.66&x=1&y=0&zoom=16
a2: http://mt1.google.com/mt?n=404&v=ap.66&x=0&y=1&zoom=16
a3: http://mt3.google.com/mt?n=404&v=ap.66&x=1&y=1&zoom=16
See these two guides for details on Quadtree coordinate system used by Google.
Coordinate systems for Google Maps and Google Satellite Images
Then create the data matrix for the new image:
mosaicimg=ArrayFlatten[{{a0, a1}, {a2, a3}}];
Draw the new image and export it:
Graphics[Raster[Reverse[mosaicimg]/255, ColorFunction -> RGBColor],
PlotRange -> {{0, 511}, {0, 511}}, ImageSize -> {512, 512}]
Export["earth.png",%,"PNG"]
This is the image used in Fun with image overlay: Google Map
First, what's inside the image?
Import["mnt.png", "Elements"]]
{"BitDepth", "ColorMap", "ColorSpace", "Data", "DataType", "Graphics", "GrayLevels", "ImageSize", "RawData", "RGBColorArray"}
We only need use the "Data": Import["mt.png","Data"]
Here we "steal" some images from Almighty Google as the example.
Import the following four images (a0,a1,a2,a3)
a0: http://mt0.google.com/mt?n=404&v=ap.66&x=0&y=0&zoom=16
a1: http://mt1.google.com/mt?n=404&v=ap.66&x=1&y=0&zoom=16
a2: http://mt1.google.com/mt?n=404&v=ap.66&x=0&y=1&zoom=16
a3: http://mt3.google.com/mt?n=404&v=ap.66&x=1&y=1&zoom=16
See these two guides for details on Quadtree coordinate system used by Google.
Coordinate systems for Google Maps and Google Satellite Images
Then create the data matrix for the new image:
mosaicimg=ArrayFlatten[{{a0, a1}, {a2, a3}}];
Draw the new image and export it:
Graphics[Raster[Reverse[mosaicimg]/255, ColorFunction -> RGBColor],
PlotRange -> {{0, 511}, {0, 511}}, ImageSize -> {512, 512}]
Export["earth.png",%,"PNG"]
This is the image used in Fun with image overlay: Google Map
Leader of the World?
The graphplot of all the countries with their major export partners.
GraphPlot[DeleteCases[Flatten[Thread[# -> CountryData[#, "ExportPartners"] /. _Missing :> {}] & /@ CountryData[]], _ -> {}], VertexLabeling -> True, MultiedgeStyle -> True, DirectedEdges -> True, Method -> HighDimensionalEmbedding]

GraphPlot[DeleteCases[Flatten[Thread[# -> CountryData[#, "ExportPartners"] /. _Missing :> {}] & /@ CountryData[]], _ -> {}], VertexLabeling -> True, MultiedgeStyle -> True, DirectedEdges -> True, Method -> HighDimensionalEmbedding]

Subscribe to:
Posts (Atom)