Step 1. Find the data you want
Just go to the agency may have the data you are interested. In this example, I will use the Indiana county boundary data I have.
There are some free/open source GIS software you can use to check the data: Quantum GIS, ArcGIS Explorer. (No offense here, I just assume you don't much about GIS.)
Step 2. Output shaple file to data
We use shp2text, and you can find more information on its website.
In command line mode:
shp2text --gpx indiana.shp
the output is the structure of the associated data in DBF file. We like to have county name, it is in Field 1.
Field 0: Type=Integer, Title=`FIPS', Width=5, Decimals=0
Field 1: Type=String, Title=`COUNTY', Width=16, Decimals=0
Field 2: Type=String, Title=`DOQ_DISK', Width=16, Decimals=0
Field 3: Type=String, Title=`FIPS_STRG', Width=16, Decimals=0
Field 4: Type=String, Title=`ATLAS_CODE', Width=16, Decimals=0
Field 5: Type=Double, Title=`AREA_FT2', Width=19, Decimals=3
Field 6: Type=Double, Title=`AREA_ACRES', Width=19, Decimals=3
Field 7: Type=Double, Title=`PERIMETER_', Width=19, Decimals=3
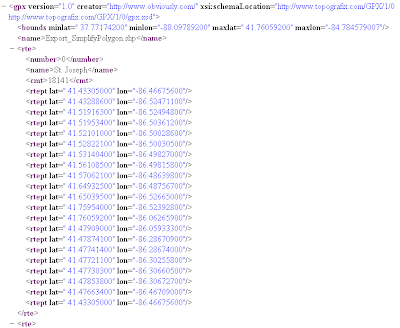
shp2text --gpx indiana.shp 1 0 > output.xml
There will dump the shape file into xml file, of course, if you can dump it into plain text without "--gpx", and reformat the plain text to cvs format. I personally prefer to XML format.

see the whole document here.
Step 3. Process XML file in Mathematica
I listed the code step by step here in case you are not familiar with XML.
dataxml = Import["output.xml"];
(* extract county names *)
countyname = Drop[Cases[dataxml, XMLElement["name", __, {w_}] :> w, Infinity], 1];
(* extract {lat, lon} for each county boundary *)
wholes=Cases[dataxml, XMLElement["rte", __], Infinity] ;
counties = (Cases[#, XMLElement["rtept", __], Infinity] & ) /@ wholes;
dataLatLon = counties /. (XMLElement["rtept", latLonRules_, {}] :> { {"lat", "lon"} /. latLonRules });
(* tidy up a little, of course, you can combine them into one line code*)
test = Flatten[#, 1] & /@ dataLatLon;
test = Map[ToExpression, test];
test = Map[Reverse, test, 2];
(* then draw it *)
Graphics[{EdgeForm[Gray], FaceForm[LightGreen], Polygon[test]}]
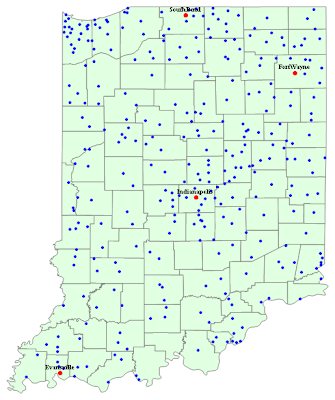
Here is the example that uses the data imported as the background map.
Point data is from CityData, and it shows all cities with population > 1000.

Importing point, line type of data is in the similar way.
1 comment:
You blog is super, thanks your code was very helpfull.
Post a Comment